Costco
— August 6, 2014Understanding the Business :
- Prominence : Costco is the world’s 4th largest discount warehouse retailer | Market Cap : 51.74B
- Location : U.S , Canada, Australia , Mexico, Japan , Korea
- Form : membership warehouses
- Product : Sundries, Food, Softlines, Hardlines and others (pharmacy, optical/hearing, Gas etc )
- Industry : Discount Retailing
- Customers : Middle Income to High income wage earners & families ( 70K + annual income )
- Product Distribution : Through a network of central depots (hubs/distribution centers) and warehouses. Products are moved using a fleet of trucks
- Growth ( 10 years ) :
- Revenue Growth : 9+% avg growth rate (except 2009)
- Membership growth : 5-6% annual growth rate ( 71M members in 2013 and expected to be 90M by 2019)
- Earnings Growth : 9.6% avg growth rate (mostly consistent except in 2009, when the EPS dropped slightly )
- Dividend Growth : 19% consistent avg growth rate over past 10 years with a current payout ratio of 25%
The Moat ( Strengths ) :
- Economics of Scale :
- World’s 4th largest Retailer
- Has a significant bargaining power with it’s suppliers
- Has extensive distribution network
- Pricing Authority & Capacity
- Private label penetration
- Customer loyalty through ( Price , Habit , quality products, new products, customer service , convenient location )
- Exclusive in-store categories( Alcohol , pharma , optical and hearing aid, Gas , Fresh food ( some prepared in store ) )
- psychological forces acting in it’s favor
- Habit
- Social Proof
- Availability
Risks :
- High concentration in U.S and Canada
- Supply disruption
- Damage to brand reputation
- Changing consumer tastes / trends ( e-commerce , online apps or product preferences. Amazon has adv )
The Future :
The Bargaining power of Suppliers : Low
Low variance in gross margins ( past 10 years) : Average gross margin is 12.5 with a standard deviation of 0.17 ( compared to 0.89 of Walmart, 0.5% of Whole Foods and 1.6 of Amazon)
- Costco acquires it’s products / goods form a diversified base of suppliers and hence limits the bargaining power of it’s suppliers.
- By introducing it’s own private labels, Costco has increased it’s profits as well as reliance on other suppliers in some of the key product categories.
The Threat of New Entrants : Low
Low Prices : ( Low operating & gross margins of 2-3% and 10-12% respectively )
Quote from Jeff : Your high margins are my opportunity.
Costco and other existing players have huge economies of scale and bargaining power helping them offer low prices. Any new entrant has to be extremely efficient and endure sustained loss for many years before they can turn profit.
Customer Loyalty : High membership renewal rate ( 90% )
Costco has a loyal customer base due to a combination of low prices, good customer service and excellent product selection. This has resulted in Costco shopping experience being part of weekly or monthly routine of many of it’s members
The Threat of Substitutes : Low ( Medium ? )
Online / e-commerce is a major threat for Costco. Most of Costco’s customers are baby boomers, however there are 77 million (25% of U.S population ) under 30 and known as millennials. The tastes and preference of millennials are significantly different from baby boomers, this group is more internet and tech savvy and are adopting online shopping more openly than baby boomers.
Costco is taking steps to attract millennials and adopt to the new trends by offering organic food in their stores and teaming up with Google Express.
One of the strong protection against substitutes are some of the store-exclusive products and services (Alcohol , Pharmacy ,eye and hearing aid, Gas, fresh/cooked meat ) that cannot be purchased online ( at least not Yet)
The Bargaining power of Customers : Medium
Customer switching cost is low , membership fee helps to bring repeat customers to the stores however there are many options available that are cheap and convenient for the customers.
- Amazon – cheap products with the convenience of home delivery
- Target / Walmart Neighborhood stores – reasonable price but has the advantage of proximity to it’s customers
Rivalry among existing competitors : Medium
Low Avg Gross & Operating margins in the retail industry ( past 10 years ) :
- Costco : 2-3% and 10-12% respectively
- Walmart : 5.6% and 25% respectively
- Amazon : 1-2% and 23% respectively
- Whole Foods : 5.2% and 34.9% respectively
Amazon competes with Costco for the same customer segment ( middle class , educated , annual income > $70K )
Is the Business Good : Yes
The Key metrics considered are ROIC and FCFROIC . We compare the ROIC against the competitors and industry benchmark.
ROIC in 2013 :
- Costco : 14.34% ( FCFROIC : 6% )
- Walmart : 13.3% * Morningstar
- Market Median : 9% ( 1994 – 2003 )
- Market Average : 14.9% ( 1992 – 2006 )
Trend in ROIC ( past 10 years ) :
| in Millions | 12/31/2004 | 12/31/2009 | 12/31/2013 | CAGR |
| Sales | 48107 | 71422 | 105156 | 9.08% |
| Equity | 7,624 | 10,018 | 11,012 | 4.17% |
| Retained Earnings | 6,139 | 6,101 | 6,283 | 0.26% |
| Operating income | 1,385 | 1,777 | 3,053 | 9.18% |
| EBIT | 1,437 | 1,822 | 3,150 | 9.11% |
| Net Income | 882 | 1,086 | 2,039 | 9.75% |
| Accounts Payable | 3,600 | 5,450 | 7,872 | 9.08% |
| Invested Capital | 11,038 | 15,705 | 21,294 | 7.57% |
| ROIC | 12.55 | 11.31 | 14.34 |
Is the Management Good ( Trustworthy & Competent ) : Yes
Financial Health :
- The interest coverage ratio (TTM) of 73.21% is evidence of Costco’s ability to easily pay interest on outstanding debt compared to the industry average of 39.77%.
- The company does not have short term debt which denotes the fact that there will be no major cash outflows in the near future.
- Costco’s total debt to equity ratio of 44.44% is beneath the industry average of 47.57%.
- Debt/ebitda =
- Debt/equity = 0.46 in 2013 ( Avg for past 10 years : 0.18 )
Operation Efficiency :
- Costco’s asset turnover of 3.45% against the industry average of 2% shows that the company is better at fetching sales despite the existence of massive competition.
- Employees per warehouse has been tightly maintained.
| 2004 | 2009 | 2013 | |
| Number of Warehouses | 417 | 527 | 634 |
| Total Employees | 113000 | 142000 | 184000 |
| Employee per Warehouse | 271 | 269 | 290 |
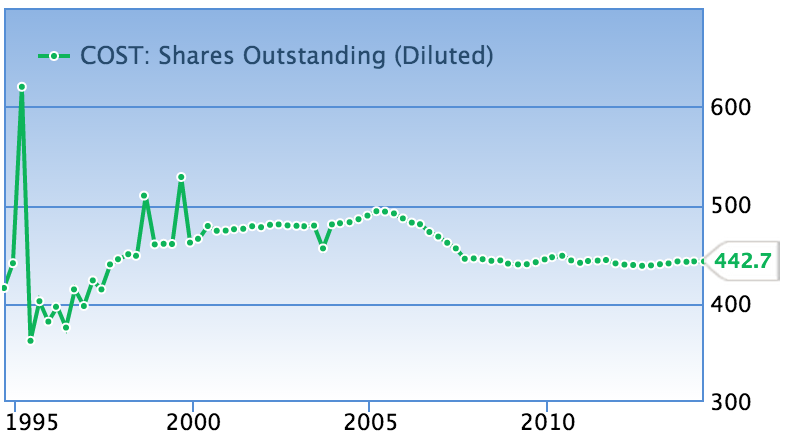
Stewardship :
- Insider ownership ?
- Number of Out standing shares over 10 years has been steady ( almost same ) over past 5-10 years
Is it Expensive (Valuation ) : Yes
- Earnings Multiple = Market Cap / OE = 51,740 / 3,053 = 17
- Enterprise Multiple = EV / EBIT = 49,700 / 3,051 = 16.28
Tagged with:
investing
About author

Hello I am Hari
I have more than 20 years experience in the information technology (IT) industry. I write about what I’m learning and some of the tips I have picked up along the way.
Leave a reply