Notes on the state of economy & markets – Nov 2021
— November 14, 2021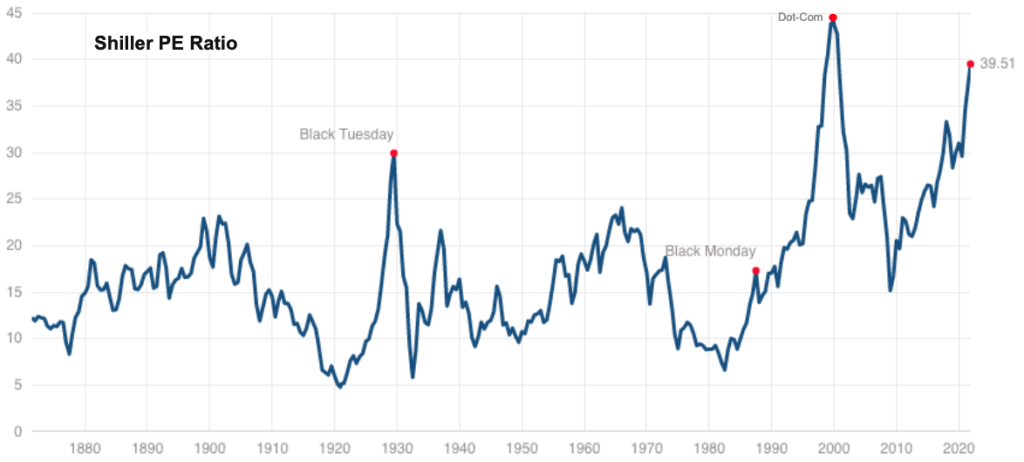
As of Nov 12, 2021 Markets are red hot, everything seems expensive (a few examples below)
- Shiller PE ratio : 40 as of Nov 12 2021 ( Mean: 16.88 , Median: 15.86 , Min: 4.78, Max: 44)
- S&P/Case-Shiller U.S. National Home Price Index at $267K is at an all-time high ( 2006 high was $184K)
- # of stocks with P/S > 10 is ~30 an all-time high ( previous high was in 1999 with ~10 stocks)
- FINRA margin debt balance in customer accounts is at an all-time high at ~$800-$900 Billion (was ~$30B in 2006 )
- Buffett Indicator ( Market Cap to GDP) is at an all-time high of 215.3%, was 71% during the dot-com bubble in 2000, which was the previous all-time high. For comparison it is
- Fed’s balance sheet is at an all-time high at $8 Trillion and still growing
- US Market cap to World GDP is an all-time high
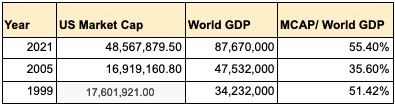 * Data in the table are in millions
Why is the market hot?
There are few narratives that are providing the excuse for investors and the general public to embrace risk or assets of all forms. They are (1) Fed Put – i.e. if markets or asset prices go down fed will come to the rescue by printing money (2) The 4th industrial revolution stocks have infinite earning potential and long runways that will be realized in the distant future, which is beyond the imagination of the boring value investors. patient investors (a.k.a. Amazon shareholders in 2000s) will reap the benefits (3) TINA – Even if Fed is not accommodative in the future there is a high level of cash sitting on the sidelines with nowhere else to go… (4) Passive Index investors will continue to blindly plow their cash into indexes and hence levitating all stocks regardless of their earnings, business quality, etc
Stats In favor of the bulls.
The M2 Money supply is at an all-time high at ~$21T, was ~$5T in 2000, and ~$6T in 2005, however, Mcap/M2 ( US equity market cap to M2 money supply ratio) is high but not all-time high.
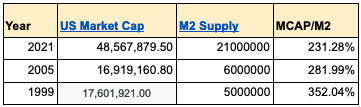 * Data in the table are in millions
Household debt to GDP is lower than previous highs at ~80%. it was ~97% in 2006 (all-time-high) , 68% in 1999. It was lower than 50% up to 1986. However, we had the dot-com at much lower levels of household debt to GDP, hence it is not a good indicator or predictor.
However, Margin as a % of total stock market cap is at all-time high
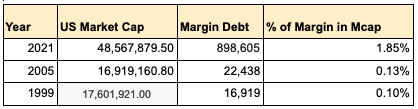 * Data in the table are in millions
Conclusion:
All markets in U.S i.e. Stocks, real estate, bitcoin, etc are running hot on leverage (e.g. margins, household debt, mortgage debt) encouraged and aided by an accommodative Federal Reserve and strong narratives listed above. Future returns might be dependent on the availability of credit and accommodative Federal reserve.
Investors have to balance between protection against inflation in case of continued easy monetary policy by the Fed and potential market dislocations due to disruptions in the availability of leverage, growth slowdown, or change in market sentiments.
About author

Hello I am Hari
I have more than 20 years experience in the information technology (IT) industry. I write about what I’m learning and some of the tips I have picked up along the way.
Leave a reply