Understanding the oil slump
— March 7, 2015The recent slump in oil prices took most of us by surprise. Oil prices have been on the rise since 2004 with a drop in the price of oil for a short period during the great recession of 2008/09.
Many investors assumed that this trend would continue and crude oil prices above $100 per barrel were considered the new normal.
As oil prices ascended, the peak oil theory gained more popularity. These prices also attracted more investment in oil exploration, specially in the U.S.
Experts point to many causes for the recent drop in oil prices, including the conspiracy by the Saudis to undermine the dominance of U.S shale companies in the world oil market and the joint effort by the U.S and its partners to put pressure on Putin and Russia by keeping the oil prices depressed for a long period.
In this post I attempt to describe the oil market and its players. I hope this will help you understand the recent slump in oil prices.
Oil Supply and Demand
Picture is worth a thousand words – Light crude prices over the past 10 years.
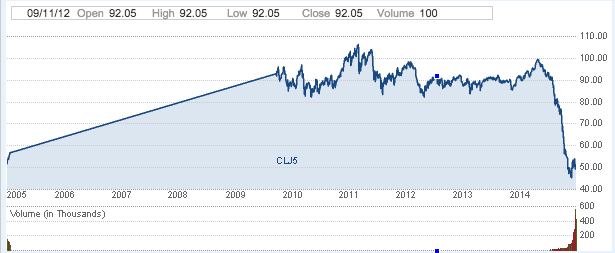
Is it a supply problem?
World oil production was stable around 85 mbd from 2005 to 2009. Between 2009 and the end of 2013 the world oil production increased by 5.1 mbd to 90.8 mbd.
The table below shows world production and consumption.
 Production and consumption in millions of barrels per day. Price in dollars per barrel (USD)
Who is contributing to the increase in oil supply since 2009?
Increases / (decreases) in oil production by region/country by the end of 2013 :
- North America : 3.87 million barrels per day
- U.S.A : 3.2 million barrels per day ( Shale oil is a big contributor – at 2 mbd)
- Canada : 755,000 barrels per day
- Central & South America : 399,000 barrels per day
- Europe : (-1.19) million barrels per day
- Eurasia (including Russia) : 762,000 barrels per day
- Middle East : 2.1 million barrels per day
- Iraq, Qatar and Saudi Arabia are key contributors ( SaudiArabiaalone increased production by 1.3 mbd )
- Africa : (-1.1 ) million barrels per day
- Asia : 212,000 barrels per day
Increases in US oil supply
Oil production in the U.S. was steady at 8.5-9 mbd, however between 2009 and the end of 2013, it increased to 12.3 million (an increase of 3.8 mbd). More than 50% of the increase (2 mbd out of 3.8 mbd) was from shale oil.
Shale Oil production in US
There are 8,000 oil producers in the U.S. (according to Bloomberg). In 2007, shale oil production accounted for 300,000 barrels per day (bbd), and in 2014 it was close to 2.4 mbd, a 2 mdb increase. In the same period, total oil production in the U.S. rose from 8.5 mbd in 2007 to 12.3 mbd in 2014
What is causing the price slump ?
There have been periods in the past when supply and demand were not balanced but we did not see a steep drop in oil prices except in 2009, which was during the great recession. In 2013 and 2014 supply and demand were not out of balance ( see tables 1 and 2 below for details ). However there are signs of a slowdown in many economies across the world and oil prices might be a leading indicator or what will follow or it might be an overreaction by the markets.
Table #1 Oil supply and demand and WTI crude prices ( 2000 – 2007)
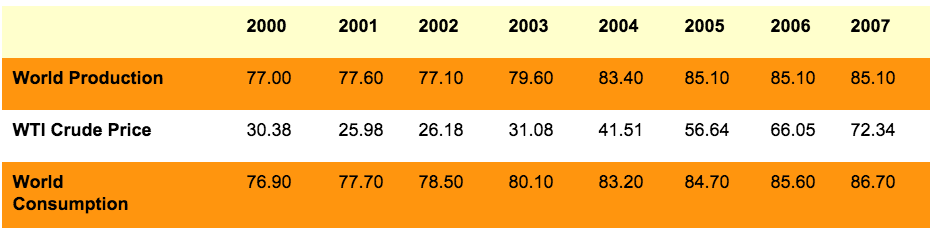
Production and consumption in millions of barrels per day. Price in dollars per barrel (USD)
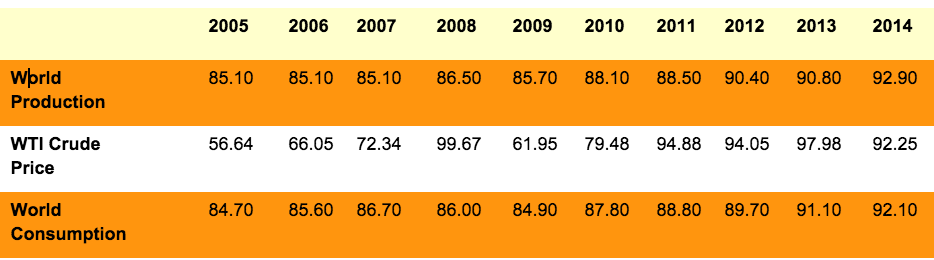
Table #2 Oil supply and demand and WTI crude prices ( 2005 – 2014)
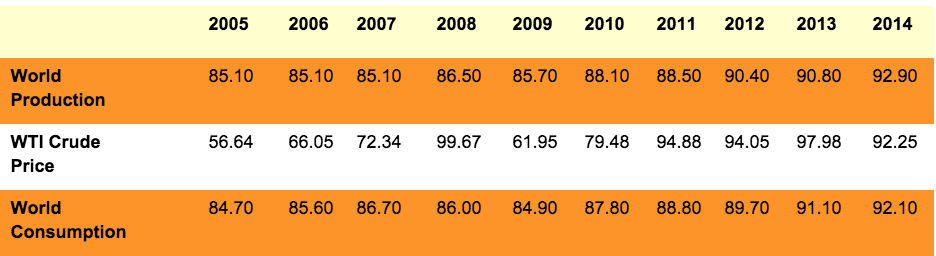
Production and consumption in millions of barrels per day. Price in dollars per barrel (USD)
In the year 2014, oil consumption in the OECD countries remained stable at around 45 million barrels per month up to September 2014 ( there is no data available yet after September 2014 in EIA ). Based on the available data, the demand for oil (monthly consumption) was similar to past couple of years and within the range of 44 to 46 million barrels per month.
Lessons learnt from the recent oil slump
The OPEC has less price control than we thought
The emergence of many shale oil producers has ensured stand-by supplier ready to take advantage of attractive oil prices. With the emergence of shale oil, US Oil production has become more similar to a standard manufacturing industry,it is easy to control supply based on the demand curve, which was not possible with the deep water exploration.
Oil prices beyond $100 are not sustainable in the short run
In oil industry the hard to get oil is generally known as “tight oil”, most of the tight oil are profitable to explore when oil prices are above the $30-$40 range ( see chart below ). Whenever oil prices go above $50, tight oil exploration will start to look attractive.
The low-cost producers will do well in the long term
The companies that will be winners are companies that:
- Will be able to position themselves low on the cost curve with a focus on efficiency and productivity,
- Have some of the better oil discoveries or higher quality oil fields – (all barrels are not created equal)
- Strong financial position to weather lower oil prices
The chart below from Citi’s Ed Morse lists the average cost of oil production by country and production type.
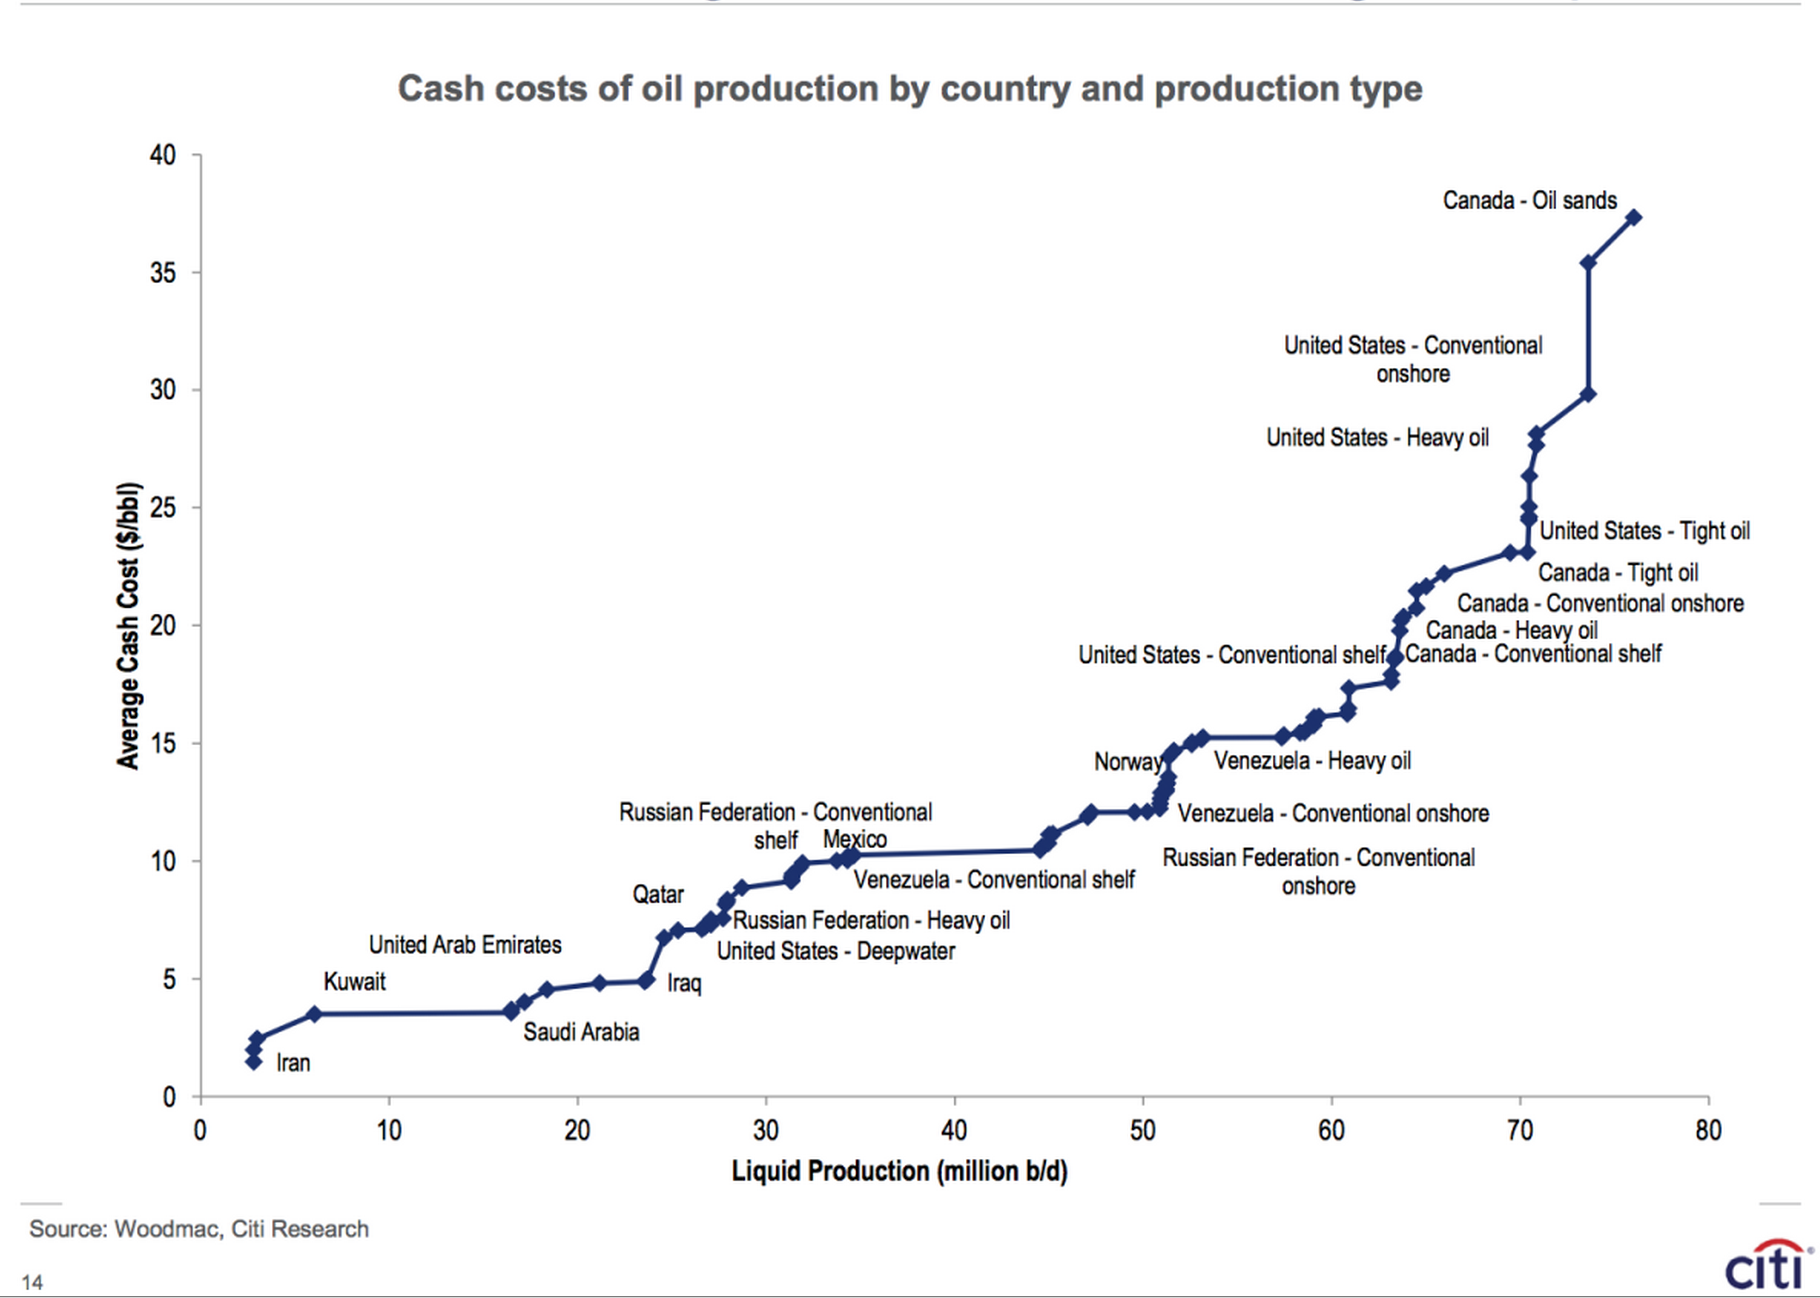
Based on this data and other sources, the Middle East has one of the lowest costs of production and naturally it is safe to assume the Saudi Aramco has significantly lower costs of production among the big oil companies. Hence Aramco is better positioned to weather the slump in oil prices than other players. However the Saudi government recently projected its biggest budget deficit ever after the oil price crash. This indicates that even with one of the lowest costs of production, the current level of oil prices (of $50 ) is not sustainable for the Saudi kingdom in the long run.
Oil is a cyclical business
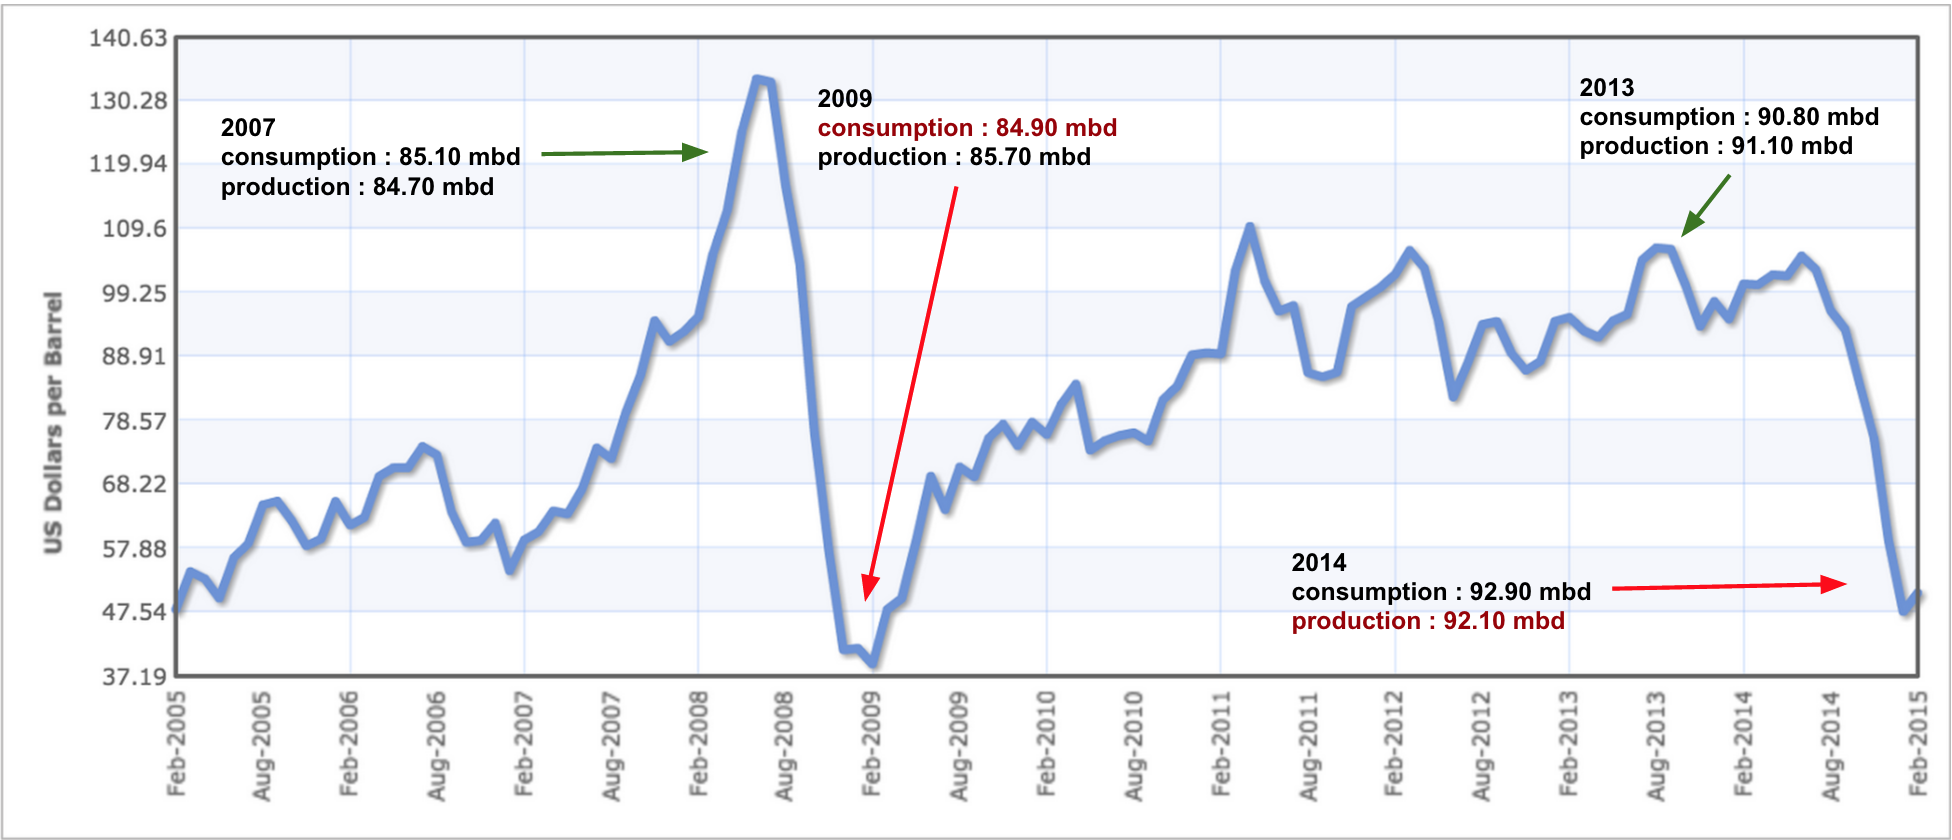
Small discrepancies between production and consumption can result in significant price volatility. The last time we saw a sudden dip in oil price was during the 2009 recession when the price fell from a high of $133.93 in June 2008 in to a low of $39.15 in Feb 2009. Post recession oil reached a high of $106.55 in Aug 2013 before the recent slump to $50.
The drop in oil price in 2009 was attributed to the great recession and weakness in demand whereas the current slump in oil price is attributed to supply glut. However the imbalance in supply and demand in terms of million barrels per day (mbd) in both periods is less than a million barrel per day (mbd) as visualized in the chart below.
Disclosure: I own shares in Exxon Mobile, Conocophillips and Phillips 66 . If you are interested in my analysis of oil companies (specifically Exxon Mobile) contact me on twitter
About author

Hello I am Hari
I have more than 20 years experience in the information technology (IT) industry. I write about what I’m learning and some of the tips I have picked up along the way.
Leave a reply