Hydrocarbon Energy
— June 13, 2014 Oil
Oil

Business Segments in Oil Industry and key players :
The oil and gas industry can be broadly classified into three segments. The upstream segment comprises exploration and production (E&P), while the downstream segment includes refining and marketing (R&M). In between, the midstream segment includes the transportation, storage, and trading.
Upstream – exploration & production
The upstream sector includes the searching for potential underground or underwater crude oil and natural gas fields, drilling of exploratory wells, and subsequently drilling and operating the wells that recover and bring the crude oil and/or raw natural gas to the surface. wikipedia
- National Oil Companies (NOC)
- Saudi Aramco (Ministry of Petroleum & Mineral Resources)
- Qatar Petroleum (Ministry of Energy & Industry)
- ADNOC (UAE Ministry of Energy)
- PDVSA (Venezuela Ministry of Popular Power of Petroleum and Mining)
- NIOC (Iran Ministry of Petroleum)
- NNPC (Nigeria)
- SOMO (Iraq Ministry of Oil)
- KPC (Kuwait Ministry of Oil)
- State owned
- Gazprom – Russia
- LUKOIL – Russia
- SINOPEC – China
- Rosneft – Russia
- PetroChina – China
- Ecopetrol – Colombia
- YPF S.A – Argentina
-
- Eni SpA – Italy
- Statoil ASA – Norway
- Sasol Ltd – South Africa
- Super Majors
- Exxon Mobile
- Chevron
- Shell
- BP
- Large Integrated
- Hess (HES)
- Oil & Gas Exploration Companies
- Anadarko Petroleum Corporation (APC)
- Occidental Petroleum (OXY)
- Marathon Oil (MRO)
- Pioneer Natural Resources (PXD)
- ConocoPhillips (COP)
- CNOOC Ltd
- Apache Corp (APA)
- Canadian National Resources Ltd
- Inpex Corp
- Chesapeake Energy Corp (CHK)
- Devon Energy Corp (DVN)
- Continental Resources (CLR)
- Noble Energy Inc.(NBL)
- Oilfield Services
- Schlumberger
- Halliburton
- Saipem
- Transocean
- Baker Hughes
- Fluor
- Weatherford International
- BJ Services Company
- Petrofac
- China Oilfield Services Ltd.
- Equipment & Supplies
- National oilwell varco
- FMC Technologies Inc
Midstream – pipelines & transportation of Oil and gas
The midstream sector involves the transportation (by pipeline, rail, barge, oil tanker or truck), storage, and wholesale marketing of crude or refined petroleum products. Pipelines and other transport systems can be used to move crude oil from production sites torefineries and deliver the various refined products to downstream distributors – wikipedia
- Transneft – Russia
- Enterprise Products Partners (NYSE: EPD ) – USA
- Plains All American (NYSE: PAA ) – USA
- Enbridge (NYSE: ENB ) – Canada
- TransCanada (NYSE: TRP ) – Canada
- Spectra Energy (NYSE: SE ) – USA
- Williams Companies (NYSE: WMB ) – USA
- ONEOK Partners (NYSE: OKS ) – USA
- Ultrapar Holdings (NYSE: UGP ) – Brazil
- Enbridge Energy Partners (NYSE: EEP ) – USA
- Cheniere Energy (NYSE:LNG) – USA
http://www.bloomberg.com/markets/companies/pipelines
Downstream – refineries & distribution
The downstream sector commonly refers to the refining of petroleum crude oiland the processing and purifying of raw natural gas, as well as the marketing and distribution of products derived from crude oil and natural gas. The downstream sector touches consumers through products such as gasoline or petrol, kerosene, jet fuel, diesel oil, heating oil, fuel oils, lubricants, waxes, asphalt, natural gas, and liquefied petroleum gas (LPG) as well as hundreds of petrochemicals. – wikipedia
- Phillips 66 – USA
- Reliance Industries – India
- Marathon Petrolium Corp – USA
- Valero Energy Corp – USA
- JX Holdings – Japan
- SK Innovation Co, Ltd – South Korea
- HollyFrontier Corp – USA
- Tesoro Corp – USA
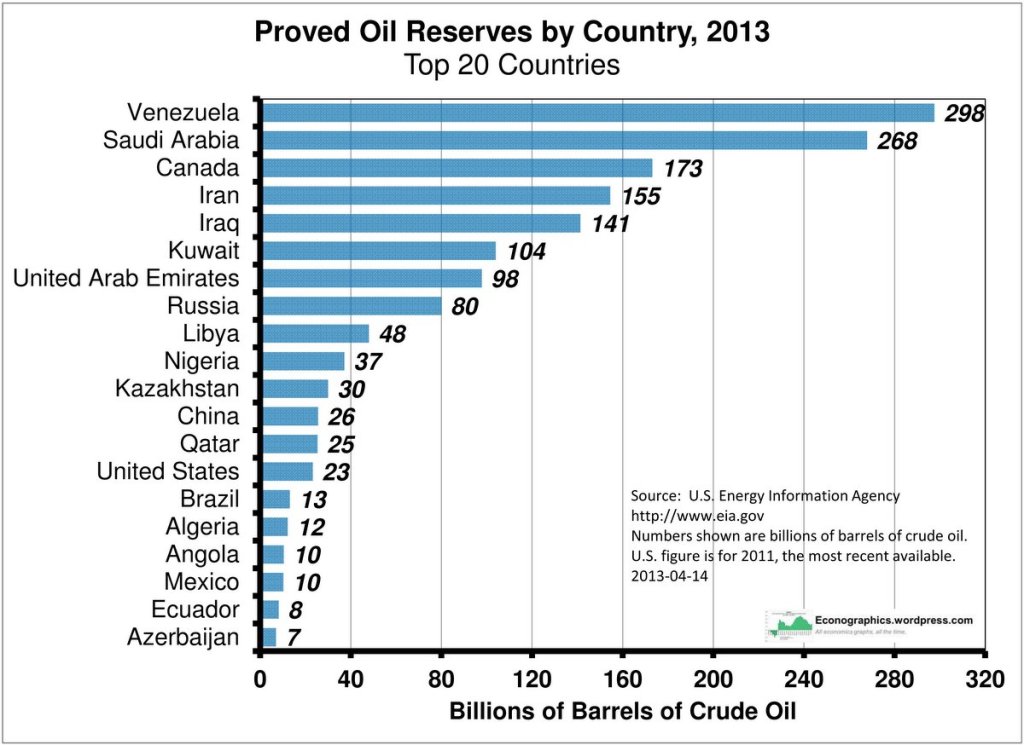
World Oil reserves

Cost of producing oil per barrel of oil ( or oil equivalent)
| Lifting Costs | Finding Costs | Total Upstream Costs | |
| United States – Average | $12.18 | $21.58 | $33.76 |
| On-shore | $12.73 | $18.65 | $31.38 |
| Off-shore | $10.09 | $41.51 | $51.60 |
| All Other Countries –Average | $9.95 | $15.13 | $25.08 |
| Canada | $12.69 | $12.07 | $24.76 |
| Africa | $10.31 | $35.01 | $45.32 |
| Middle East | $9.89 | $6.99 | $16.88 |
| Central & South America | $6.21 | $20.43 | $26.64 |
* 5,618 cubic feet of natural gas equivalent to one barrel. ( source – EIA )
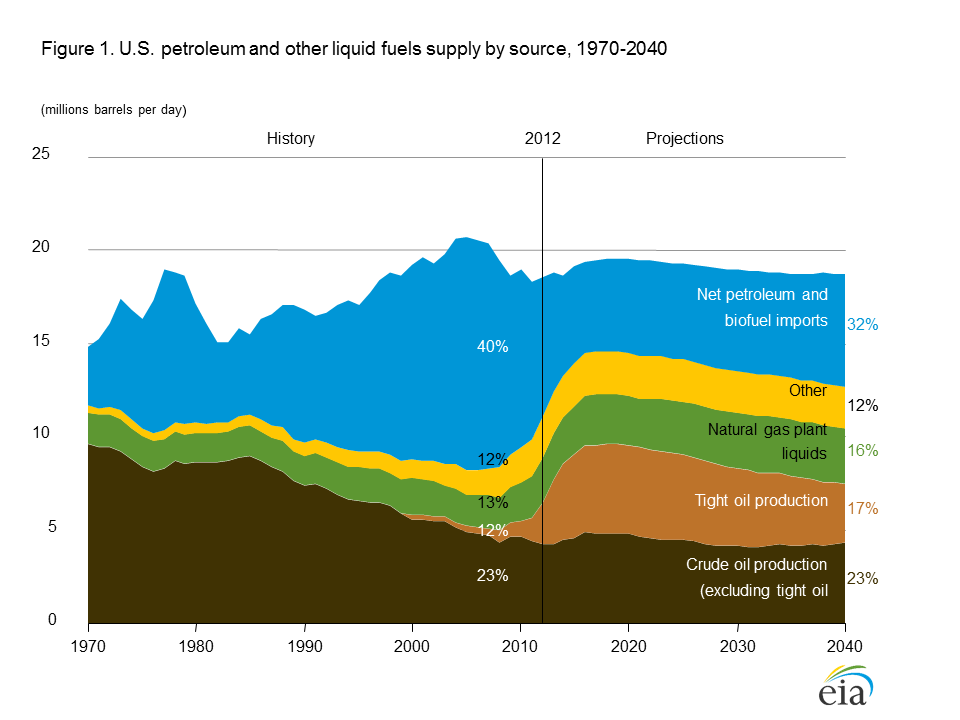
Fuel sources present and future outlook (EIA)
Top Hydrocarbon producers
| Company | Assets | Revenue | Profits | Margins | Proved Reserves | Country | ROIC% | 3Yr CGR |
| TNK-BP | 35 | 53 | 1 | 1.89 | 9 | Russia | 28 | 9.7 |
| Ecopetrol | 52 | 37 | 9 | 24.32 | 2 | Colombia | 18 | 31.3 |
| CNOOC | 60 | 38 | 11 | 28.95 | 3.19 | China | 17 | 33 |
| LUKOIL | 91 | 134 | 10 | 7.46 | 17.3 | Russia | 14 | 19.7 |
| Rosneft | 106 | 90 | 12 | 13.33 | 22.8 | Russia | 10 | 27.1 |
| PetroChina | 301 | 310 | 21 | 6.77 | 11.1 | China | 7 | 29.1 |
| ConocoPhillips | 153 | 235 | 12 | 5.11 | 8.4 | USA | 10 | -24 |
| Total | 205 | 209 | 15 | 7.18 | 11.4 | France | 10 | 17.6 |
| Statoil | 129 | 108 | 13 | 12.04 | 5.4 | Norway | 16 | 15.1 |
| Gazprom | 328 | 139 | 39 | 28.06 | 14.2 | Russia | 12 | 16 |
| BP | 293 | 376 | 26 | 6.91 | 17.7 | UK | 7 | 16.1 |
| Chevron | 209 | 236 | 27 | 11.44 | 4.3 | USA | 17 | 11.8 |
| Shell | 345 | 470 | 31 | 6.60 | 14.2 | Netherlands | 12 | 18.9 |
| Exxon | 331 | 434 | 41 | 9.45 | 24.9 | USA | 24 | 15.8 |
Na tural Gas

Top 10 countries with proven Natural Gas reserves
| 1 | 48,700,000,000,000 | 12 June 2013 est.[7] | |
| 2 | 33,600,000,000,000 | 12 June 2013 est.[8] | |
| 3 | 25,100,000,000,000 | 12 June 2013 est.[9] | |
| 4 | 17,500,000,000,000 | 12 June 2013 est.[10] | |
| 5 | 9,460,000,000,000 | 12 December 2013[11] | |
| 6 | 8,200,000,000,000 | 1 January 2012 est.[12] | |
| 7 | 5,524,500,000,000 | 19 July 2011[13] | |
| 8 | 5,246,000,000,000 | 1 January 2010 est. | |
| 9 | 4,502,000,000,000 | 1 January 2010 est. | |
| 10 | 3,825,000,000,000 | 1 January 2012 est.[12] |
Top U.S Natural Gas Producers
|
Company |
Total Production (MMcfe/day) |
U.S. Nat Gas as % of Total Production |
|
|---|---|---|---|
| 1 | ExxonMobil | 26,376 | 14.5% |
| 2 | Chesapeake Energy | 3,049 | 84.5% |
| 3 | Anadarko | 4,110 | 56.6% |
| 4 | Devon Energy | 3,960 | 51.2% |
| 5 | Encana | 3,395 | 54.9% |
| 6 | BP | 20,598 | 8.9% |
| 7 | ConocoPhillips | 9,840 | 16.8% |
| 8 | Southwestern Energy | 1,364 | 98.7% |
| 9 | Chevron | 16,140 | 8.0% |
US Natural Gas Consumption overall and by sector


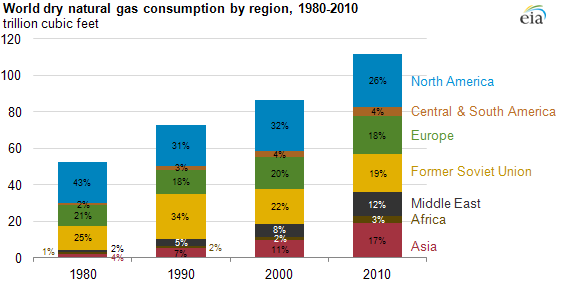
Global Natural Gas Consumption doubled from 1980 to 2010
Resources :
- http://www.pipelineandgasjournal.com
- http://www.opec.org/
- http://www.oilandgasiq.com/
- on natural gas – http://www.hubbertpeak.com/gas/eia/
- http://www.unitedstatescommodityfunds.com/
About author

Hello I am Hari
I have more than 20 years experience in the information technology (IT) industry. I write about what I’m learning and some of the tips I have picked up along the way.
Leave a reply